How Live Broadcast Features Shape Modern Formula 1 Fandom
Special FeatureThursday, 16 April 2026 at 12:33
Formula 1 viewing has become more interactive as live streams, second-screen data, and social chat tools develop.
Many fans now follow races through interfaces that resemble studio broadcasts, with presenters, overlays, and rapid-fire updates. Dragonia is one example of how real-time presentation techniques can influence what audiences expect from live entertainment.
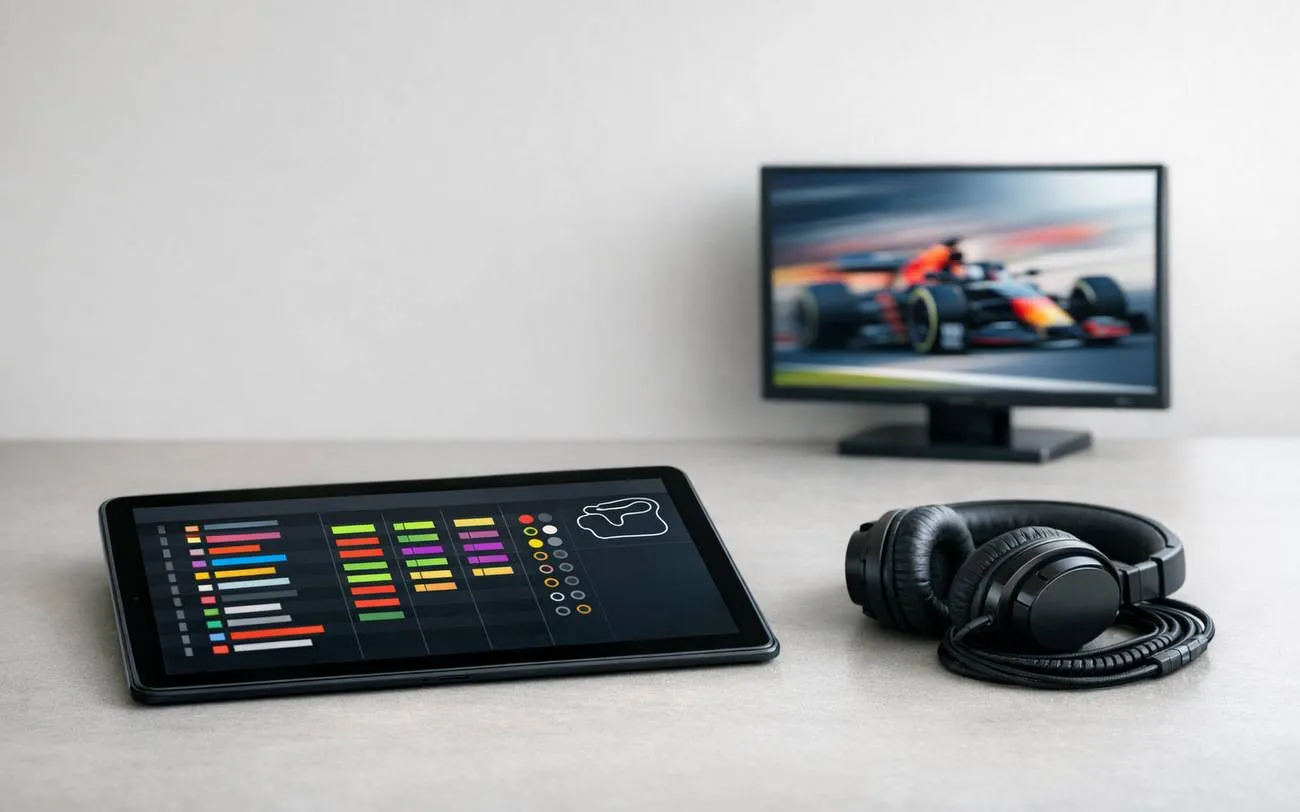
Race-day viewing is no longer limited to a single TV feed, as modern audiences often combine live pictures with timing screens, onboards, and commentary clips. These elements create a structured “show” rhythm, with clear phases that echo the way other live entertainment formats manage pacing and anticipation.
For F1 fans, the result is a more guided experience that can make complex moments easier to follow. It also changes how attention moves during a session, from long stints to short bursts of high-focus action.
How presenter-led coverage changes the pace
Presenter-driven segments can make live coverage feel more like an event than a continuous broadcast. Pre-race grids, safety car periods, and post-session analysis are often framed with quick recaps, highlighted talking points, and prompted debates. This structure helps viewers track developing narratives such as tyre compounds, pit window threats, and intra-team battles without needing to interpret every data point themselves.
In F1, that pacing matters because long green-flag runs can look calm on the surface while strategy shifts underneath. When presenters and analysts signpost the key variables—lap-time trends, traffic risk, or degradation expectations—fans are more likely to notice subtle swings. It can also increase attention on marginal calls, such as whether to undercut, protect track position, or accept a slower stint to extend flexibility later in the race.
Why real-time overlays and timing graphics influence understanding
Live timing and broadcast graphics provide a layer of context that changes how fans interpret what they see on track. Gaps to the car ahead, tyre age indicators, and pit stop loss estimates turn raw racing into a set of immediate comparisons. When used consistently, overlays reduce the barrier to understanding why a driver is pushing, managing, or appearing to “stall” even while the lap time is strategically useful.
Because the sport is shaped by regulations, tyre behaviour, and energy deployment limits, the best graphics focus on variables that directly affect decision-making. Clear explanations of delta targets during safety cars, or how DRS train effects can freeze the midfield, help audiences connect cause and effect. Over time, repeated exposure to the same metrics can also teach casual viewers the basics of racecraft and strategy.
How interactive chat and second screens shape fan behaviour
Second-screen tools—live timing apps, onboard selections, and social feeds—encourage fans to build their own race-day workflow. Many viewers follow the main broadcast while checking sector times, radio messages, and incident notes in parallel. This layered approach changes the viewing habit from passive watching to continuous monitoring, with frequent shifts in attention depending on what appears in the data.
Interactive chat adds another dimension by making interpretation communal. During contentious moments—track limits calls, safety car timing, or teammate battles—fans tend to form quick consensus or split into rival readings of the same incident. The pace of chat can amplify certain narratives, especially when clips circulate quickly and are replayed alongside live timing changes, creating a rolling conversation that tracks the race minute by minute.
Latest News
Loading